Sixty days of Bangalore traffic, and why I stopped.
A retrospective on blore-traf: a streaming lakehouse on free infrastructure that measured travel time on 16 tech corridors and answered one commuter question, when should I leave? Every layer ran on real data. Then I read the data licence closely and stopped collecting.
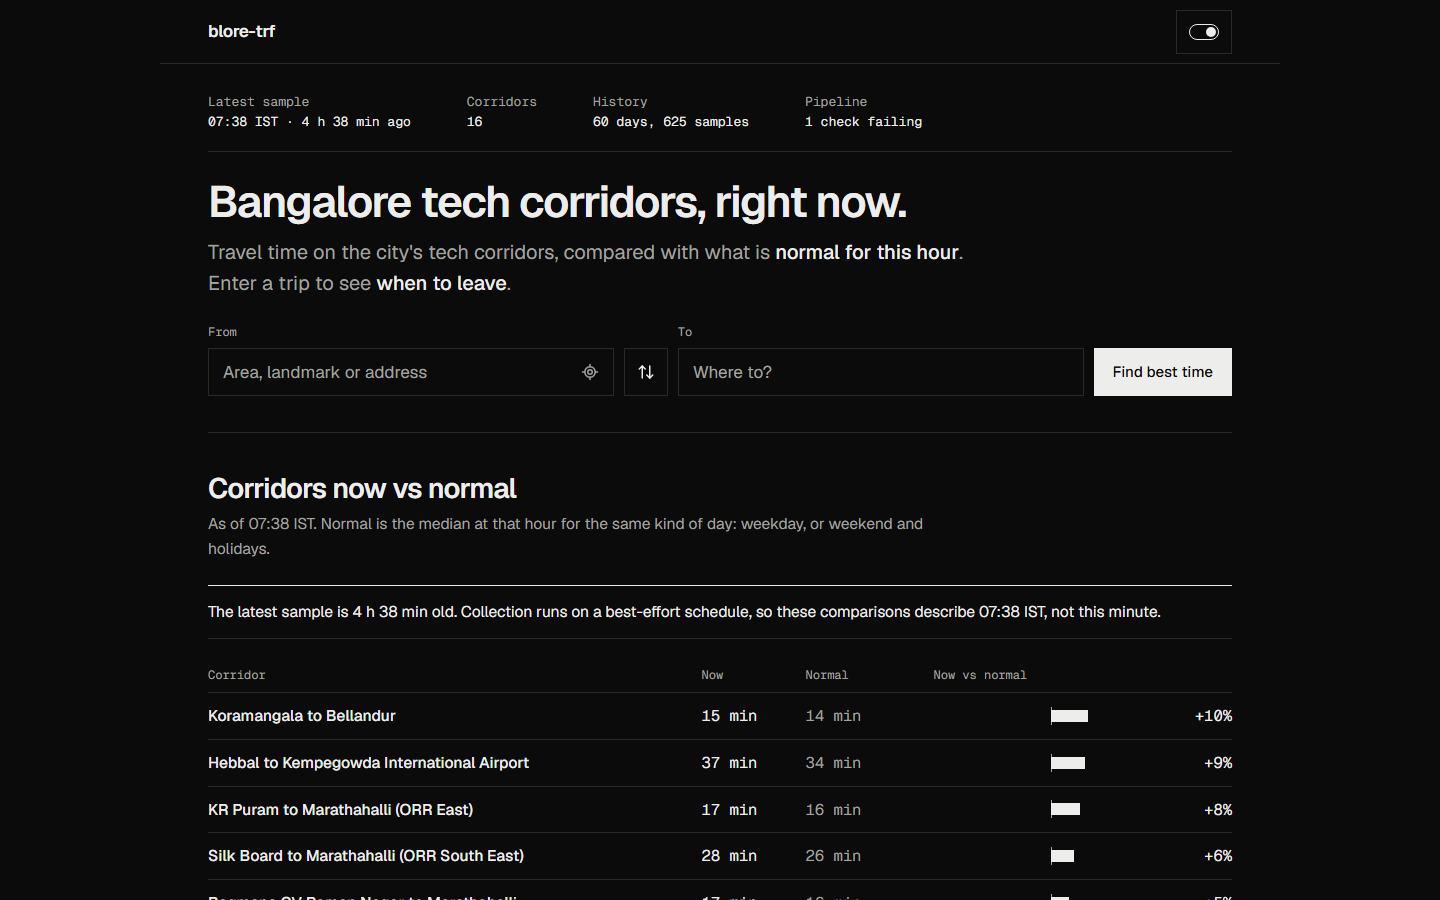
The platform polled live travel time for 16 corridors several times an hour, stored only what it derived, and turned it into a median for every corridor, weekday or weekend, and hour. A local app compared any route against that normal and suggested when to leave.
Collected
60 days
Samples
625
Observations
9,999
Corridors
16
Questions it answered
How bad is this corridor right now compared to its own normal?
When should I leave in the next few hours?
Is today unusual, and does rain explain it?
2
What was built
A medallion pipeline: pandas where the volume is small, PySpark and Delta where the semantics matter, and GitHub Actions as the only infrastructure. Running cost: $0 a month.
Architecture
Pipeline, as built
Built and run on real data
Select a step to see what it does.
Layers
Ingest
Hourly GitHub Actions run, pandas. Polls all 16 corridors 3 times, or 10 at peak, plus current weather. One corridor failing never discards the other fifteen.
Bronze
One Parquet file per completed UTC day, written once, with a fixed schema. Raw provider responses are deleted after 7 days.
Silver
Spark Structured Streaming with Trigger.AvailableNow and a checkpoint. Validates, derives the IST calendar, deduplicates within a 48-hour watermark, quarantines bad rows, and writes Delta with an insert-only MERGE.
Gold
Star schema: an SCD Type 2 corridor dimension, a date dimension with holidays, and a fact table joined to the corridor version in force when each sample was taken.
Baseline
Median travel time per corridor, day type and IST hour, with p25, p75 and a sample count. Cells under 8 samples are flagged, never hidden.
Quality
Five gates (freshness, completeness, volume, validity, nullity) write a health file and fail the daily build on breach.
App
A Next.js app run locally: corridors now vs normal, route matching against monitored corridors, and a departure forecast that carries its own confidence.
Decisions
Seal bronze by day
Chose
Write each UTC day to bronze once, after it ends. Today lives only in raw.
Rejected
Rewriting today’s bronze file every hour.
Why
Spark’s file stream tracks files by path. A file rewritten during the day is read once, partial, and every later rewrite is ignored without an error.
Spark daily, pandas hourly
Chose
pandas for the hourly ingest; PySpark and Delta for the daily transform.
Rejected
Spark everywhere.
Why
An hourly run handles at most 160 rows. JVM start-up would cost more than the work. Daily is where MERGE semantics and a streaming checkpoint earn their keep.
Observations are insert-only
Chose
MERGE … WHEN NOT MATCHED INSERT on run and corridor.
Rejected
Upserts, or trusting the scheduler to fire exactly once.
Why
Reprocessing the same input, even after deleting the checkpoint, is a no-op. The watermark bounds state; the merge is the guarantee.
Corridors are SCD Type 2
Chose
Version a corridor when its coordinates change; facts keep the version they were captured under.
Rejected
Overwriting the corridor in place.
Why
A corrected coordinate routes a different road. Overwriting would attach weeks of history to a route that was never measured.
Coarser baselines, honestly
Chose
Day type × hour, with sample counts shown.
Rejected
The planned weekday × 15-minute grain.
Why
After incident 1 there was under one sample per cell at the finer grain. Filling it would have meant inventing data.
Phase 2Streaming silver layer with checkpoints and watermarkingDone
Phase 3Gold star schema, SCD2 corridor dimension, PySpark backfillDone
Phase 4Quality gates and pipeline health fileDone
Phase 5Local web app: route input, now vs normal, best time to leaveDone
CollectionStopped after 60 days; data kept private for licensing reasonsStopped 15 Oct
3
What broke
Three incidents, each found by looking rather than by an alert. Two were schema drift; one was the infrastructure quietly doing less than it promised.
1. The scheduler delivered about 5% of runs
Found
Profiling samples per day before building silver. Every run that did execute reported healthy, so nothing alerted.
Cause
GitHub Actions schedules are best-effort; on free public repos, 15-minute crons were mostly dropped. Mean 10 samples a day against 96 expected, skewed toward off-peak hours.
Fix
Moved density in-process: each run takes several samples spaced through the hour. Delivery stayed at about 6 runs a day, but samples rose to about 29 a day.
2. Rain changed type between days
Found
Reading every bronze file’s schema before writing the stream’s explicit schema: 3 schemas across 60 files.
Cause
Open-Meteo returns whole numbers as JSON integers. On a dry day every value is 0, pandas infers integers, and Spark 3.5 cannot widen integer to double.
Fix
Pinned every bronze column’s type at write time and conformed all historical files in place, since their raw source had already expired.
3. An all-null column broke the first Spark run
Found
The first CI run of the Spark tests: 3 of 4 failed with CANNOT_DETERMINE_TYPE.
Cause
A column with only nulls has no type. A day where weather failed for every run would have produced exactly that file in production.
Fix
Bronze is reindexed to a fixed column list with fixed types, and the tests now read through the same Parquet path and schema as production.
4
What the data showed
A handful of aggregates from the final baseline. The underlying data stays private, so these are the only figures published.
+113%
Marathahalli to Silk Board, weekday 21:00 vs 06:00Median 44.7 min at its worst hour against 21.0 min at its calmest. The worst corridor in the set.
3 of 16
Corridors that more than double at their peakMarathahalli to Silk Board, Bellandur to Sarjapur Road, and Domlur to Marathahalli.
+0.2%
Median slowdown in rain, 1,504 rainy observationsNo measurable effect at this resolution. Weather came from a single point at the city centre, so local downpours were invisible to it.
69%
Baseline cells with at least 8 samples528 of 768 corridor × day type × hour cells. The rest are flagged rather than hidden.
Travel times from the Mapbox Directions API, weather from Open-Meteo (CC BY 4.0). Peak hours come from weekday medians with at least 8 samples; collection before 13 Oct skewed toward off-peak hours, so treat the exact peak hour as indicative.
Mapbox allows non-production use: development, evaluation, testing and demonstration. An analytics application needs a separate commercial licence for production use, and keeping Directions results is governed by its product terms. A public dataset or a hosted app would have crossed that line.
Scheduler
The free scheduler delivered about a quarter of hourly runs. That capped the baseline at hourly grain, and a paid scheduler would have ended the $0 premise.
What stays
The code, tests, decisions and incident log are public. The collected data and its commit history are in a private repository, available on request.
The engineering held up. The licence decided what the project could become, and I should have read it before the first request was stored, not after sixty days of them.
6
What I would change
Start from the data licence, not the architecture. Read the provider’s product terms before the first request is stored.
Trigger collection from a reliable external scheduler, so sampling density is a design choice rather than an accident.
Put the data in object storage with lifecycle rules from day one instead of committing it to git.
Capture weather per corridor, not per city; one point at the centre cannot see a local downpour.
Add a schema contract test on the first day of ingestion. Two of three incidents were schema drift.